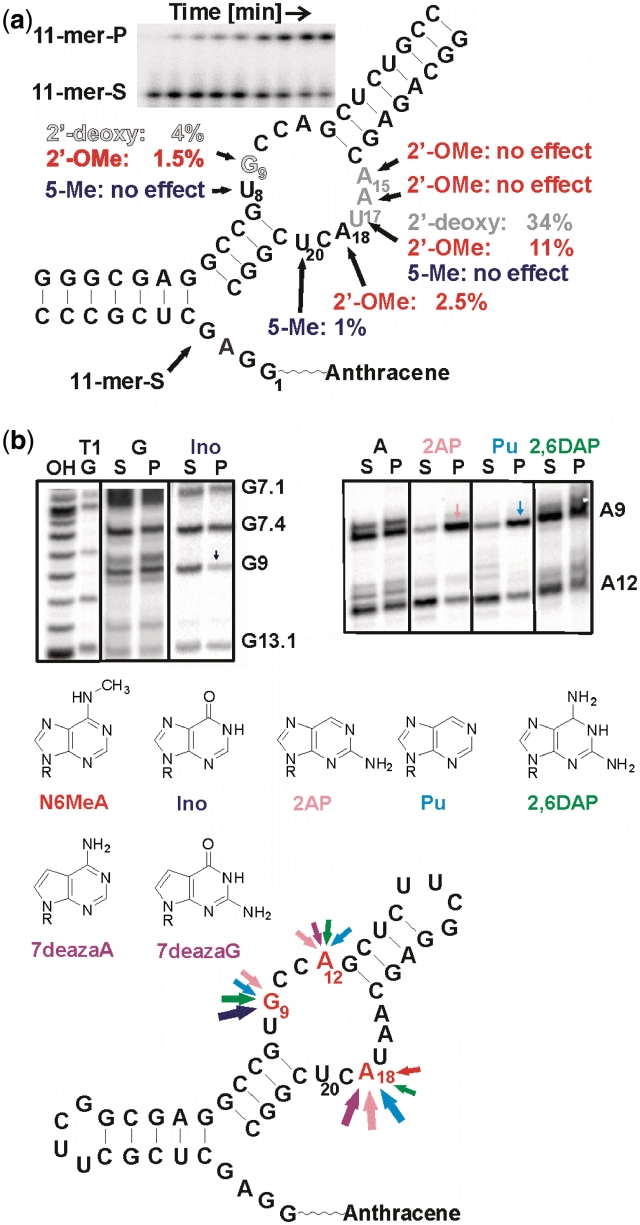
Figure 2.
Single mutation analysis. (a) Individual site-specific mutations. Gray scale represents activity of 2′-deoxy mutants: black—no effect, gray—slight reduction, white w. black hairline—strong effect. Red: 2′-O-methyl substitutions. Blue: 5-methyl substitution. The inset shows a typical assay gel for determination of kobs in the tripartite ribozyme assay. S—substrate, P—product. (b) NAIM. PAGE gels showing interferences at positions 9 and 12. Bottom: summary of nucleotide analog effects. Arrow size corresponds to the magnitude of the effects.

