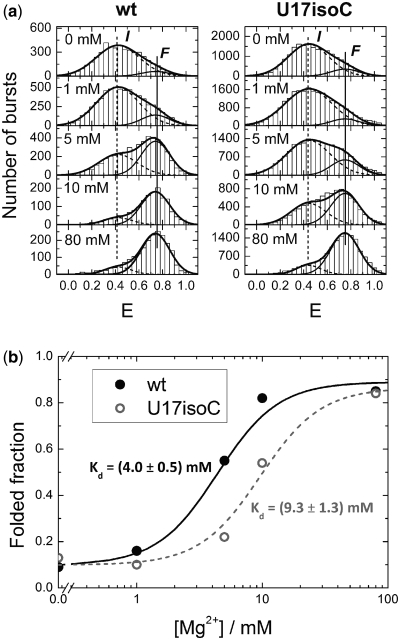
Figure 4.
Histograms of smFRET efficiency values, E, measured on freely diffusing wild-type ribozyme (left) and U17isoC mutant (right) molecules in buffer solutions at five different Mg2+ concentrations. Dashed and solid thin lines represent best-fit model distributions for the I and F states, respectively; the solid thick line gives the sum of the distributions. It should be noted that, in comparison to our previous work (12), the dye positions were changed to ensure full catalytic activity of the wild-type construct.

