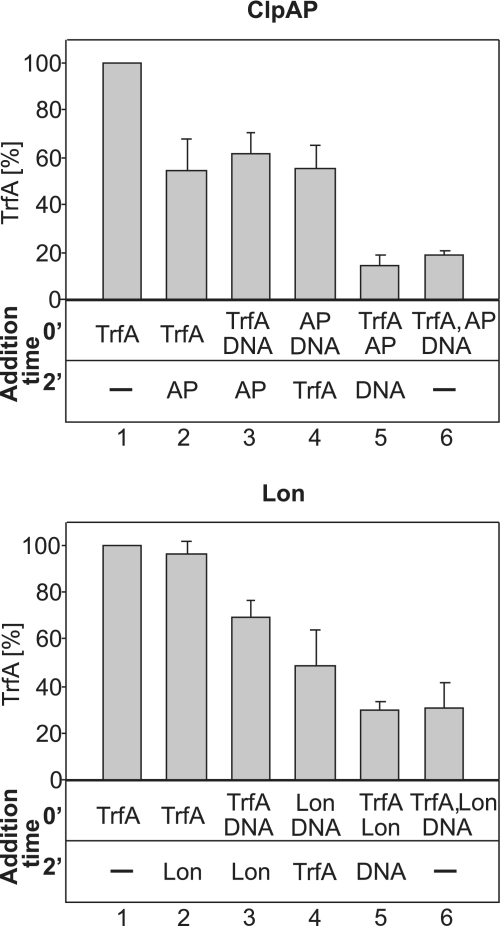
Figure 6.
Addition order of reaction components affects the efficiency of TrfA degradation by ClpAP and Lon in vitro. TrfA proteolysis reactions were performed essentially as described in ‘Materials and Methods’ section. The volumes of reaction mixtures were 25 µl. Reaction components—wt TrfA, pBK20 and protease (ClpAP or Lon)—were mixed together in different orders. For reactions 3–5, the mixtures containing two components were initially pre-incubated for 2 min at 32°C, then the remaining component was added. For reactions 1 and 6, there was no pre-incubation step. All reaction mixtures were further incubated for 2 h at 32°C and analyzed by SDS–PAGE, followed by Coomasie staining and densitometric analysis of the amount of TrfA. All bars on the graphs represent mean results of three independent experiments. Amounts of proteases used were 150 ng ClpA and 500 ng ClpP or 1.5 µg Lon.

