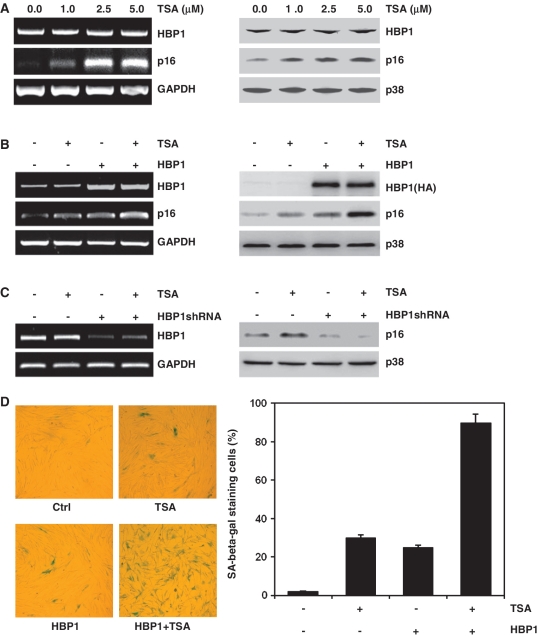
Figure 1.
HBP1-induced p16INK4A expression was enhanced by TSA treatment. (A) 2BS cells were treated with TSA at different concentration (0, 1, 2.5, 5 μM) for 18 h. The mRNA levels of p16INK4A and HBP1 were determined by RT–PCR (left panel). The protein levels of HBP1 and p16INK4A were determined by western blot (right panel). (B) 2BS cells were stably infected with pITA-HBP1. After selection for 3 days, cells were treated with TSA at 1 μM for 18 h. mRNA (left panel) and protein (right panel) were extracted for analysis. (C) 2BS cells were transfected with pHBP1shRNA or pSuper.retro (as control). After selection for 3 days, cells were treated with TSA at 1 μM for 18 h. The left panel shows HBP1 knockdown efficiency determined by RT–PCR and the right panel shows the protein level of p16INK4A measured by western blot. (D) Young 2BS cells (PD20) were transfected with pITA-HBP1. After selected with puromycin for 3 days, cells were treated with TSA. Then the cells were stained for SA-β-gal (left panel). The percentage of cells positive for SA-β-gal in 2BS cells is shown in right panel. At least 300 cells were counted for each sample.

