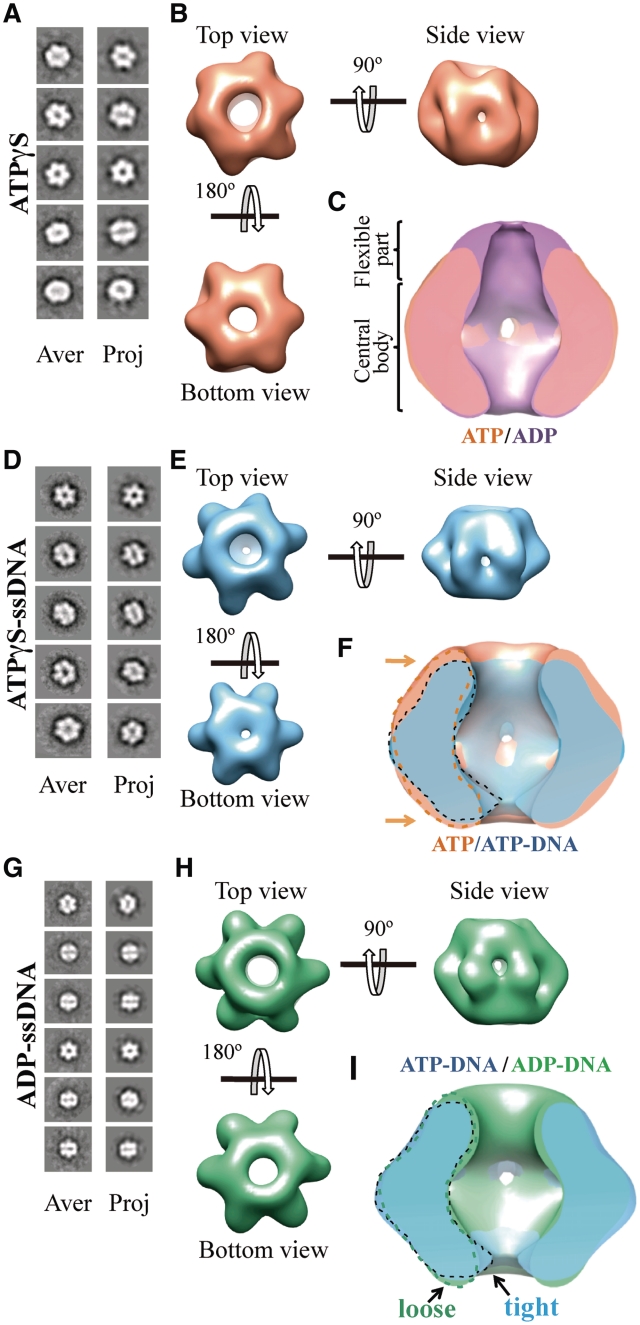
Figure 6.
3D reconstruction of BcMCM–ATPγS, BcMCM–ATPγS-DNA and BcMCM–ADP complexes. (A) BcMCM–ATPγS reference-free class averages (left panel) and corresponding reprojections from the final structure (right panel). (B) Several views of different surface representations of a 3D reconstruction of BcMCM–ATPγS hexamer filtered to 36 Å. (C) Superposition of the symmetrized cut-open side views of BcMCM–ADP model in magenta and the symmetrized BcMCM–ATPγS in orange. ATP hydrolysis does not introduce large conformational changes in the BcMCM central body region. (D) BcMCM–ATPγS–ssDNA reference-free class averages (left panel) and corresponding reprojections from the structure (right panel). (E) Several views of different surface representations of BcMCM–ATPγS–ssDNA hexamer filtered to 33 Å. (F) Superposition of symmetrized cut-open side views of BcMCM–ATPγS model in orange and the symmetrized BcMCM–ATPγS–ssDNA in blue. One monomer of a BcMCM–ATPγS–ssDNA is highlighted with a dashed black line while one monomer of the BcMCM–ATPγS is highlighted with a dashed orange line. Conformational changes upon DNA binding (indicated by an arrow) permit a closer interaction of the DNA with the BcMCM hexamer. (G) BcMCM–ADP–ssDNA reference-free class averages (left panel) and corresponding reprojections from the structure (right panel). (H) Different views of a surface representation of a 3D reconstruction of BcMCM–ADP–ssDNA hexamer filtered to 33 Å. (I) Superposition of symmetrized cut-open side views of BcMCM–ATPγS–ssDNA model in blue and the symmetrized BcMCM–ADP–ssDNA in green. One monomer of a BcMCM–ATPγS–ssDNA is highlighted with a black line while one monomer of the BcMCM–ADP–ssDNA is indicated with a dashed green line.

