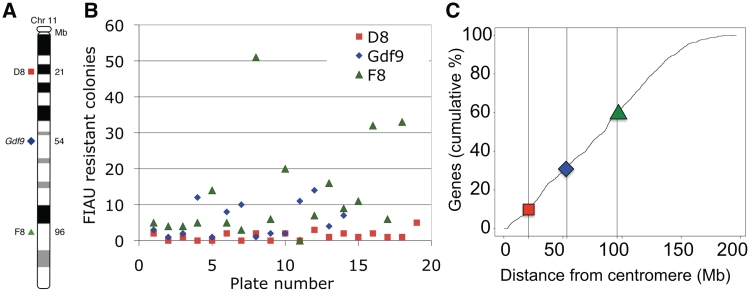
Figure 4.
Measurement of LOH rate at different loci. (A) Position of loci investigated on chromosome 11. (B) Number of FIAU resistant colonies obtained (one-tenth of each culture was plated). Data are shown in the original random order, and the rate calculation shown in Table 2. (C) Cumulative frequency plot of all Vega-curated gene start sites (37). The positions of the loci investigated here are marked.

