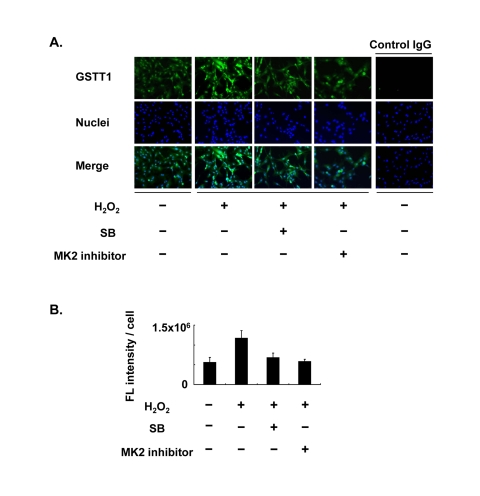
Figure 2.
Effects of the MK2 inhibitor on the expression of GSTT1 in KGN cells stimulated with H2O2 Cells were treated with H2O2 at 200 μM with or without SB203580 at 10 μM or CMPD1 at 330 nM for 24 h and subjected to immunofluorescence analysis (A). The primary antibody against GSTT1 was probed with anti-rabbit IgG-Alexa488 (Green). Cells were counterstained with Hoechst 33342 at 10 μM (Blue). Magnification: ×200. A bar graph represent the mean fluorescence intensity per cell ± SEM (B, C). One-way ANOVA: (B) P < 0.05; (C) P < 0.01.

