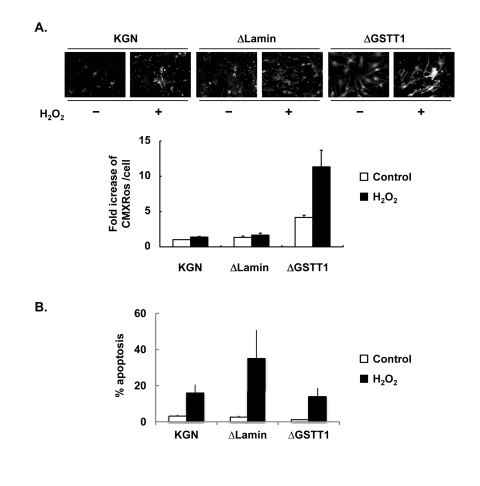
Figure 5.
Depletion of GSTT1 enhances mitochondrial activity. (A) Wild-type, ΔLamin or ΔGSTT1 cells were stimulated with H2O2, and the mitochondrial membrane potential of each cell type was observed by staining with Mitotracker CMXRos at 100 nM. A bar graph represent the fold increase in mean fluorescence intensity ± SEM. One–way ANOVA: P < 0.001. (B) Frequency of apoptosis before and after treatment with H2O2 was measured by TUNEL assay. The number of apoptotic cells was counted and divided by the total number of cells per field. A bar graph represent the frequency of apoptosis ± SEM.

