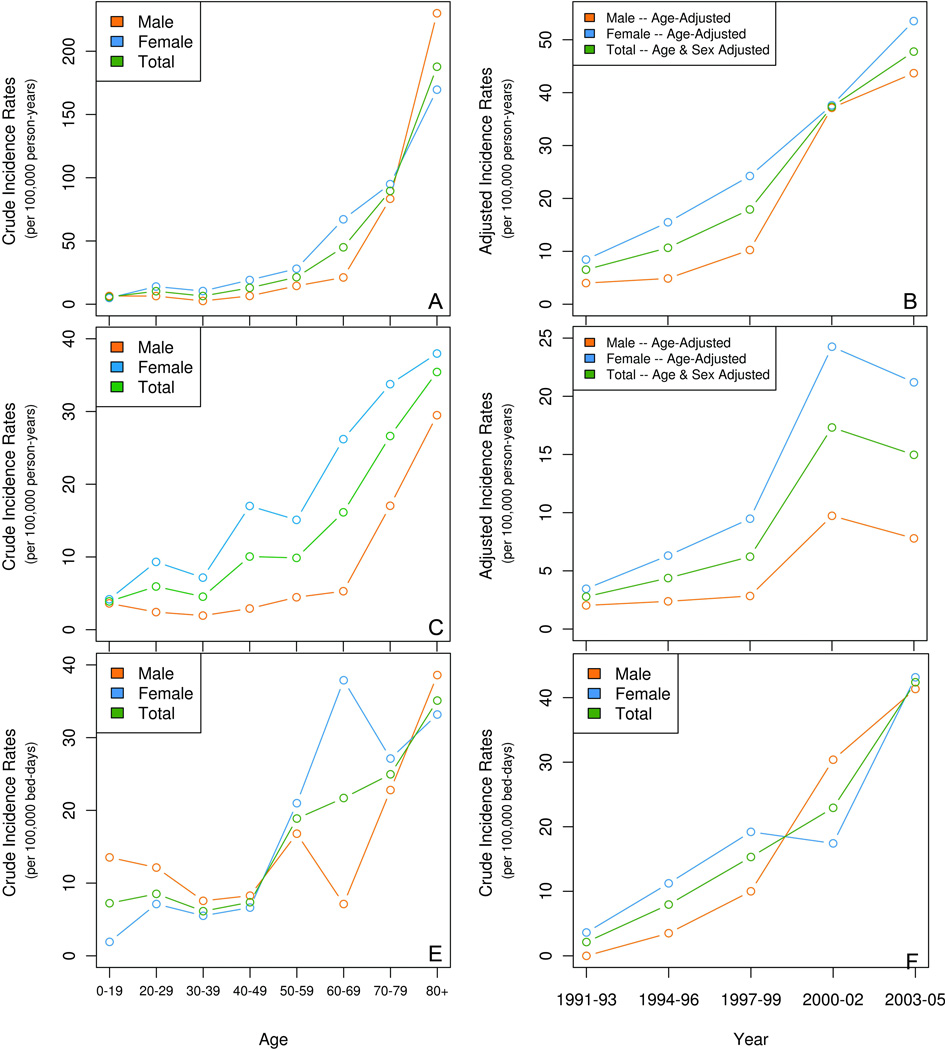
Figure 2. Incidence rates of Clostridium difficile infection in Olmsted County, Minnesota.
The top two panels show the incidence data for the overall study population, both age-specific (2A), and age and gender adjusted rates over time (2B). The middle two panels show the incidence of community-acquired infection, both age-specific (2C), and age and gender adjusted rates over time (2D). The lower two panels show the incidence of hospital-acquired infection, both age-specific (2E) and by calendar period (2F).

