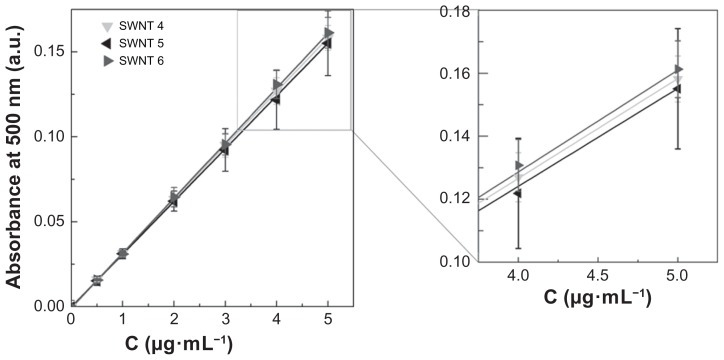
Figure 6.
Experimental standard curves of single-walled carbon nanotube sample 4–6 dispersions in 1,2-dichlorobenzene. Experimentally determined seven-point average standard curves of NanoIntegris single-walled carbon nanotube samples 4–6 (P > 0.05) were determined using an ultraviolet-visible near infrared spectrophotometer at a wavelength of 500 nm. The inset shows the standard curve at higher concentration for better comparison. The standard curve of single-walled carbon nanotube sample 4 is an exact superposition of the standard curves of single-walled carbon nanotube samples 5 and 6 in a ratio of 1:2, respectively (representing the structural composition of single-walled carbon nanotube sample 4).
Note: P values were calculated using one-way analysis of variance with a Tukey multiple comparison post-test for n = 15 at a 95% confidence value.
Abbreviations: SWNT, single-walled carbon nanotubes; MWNT, multi-walled carbon nanotubes.

