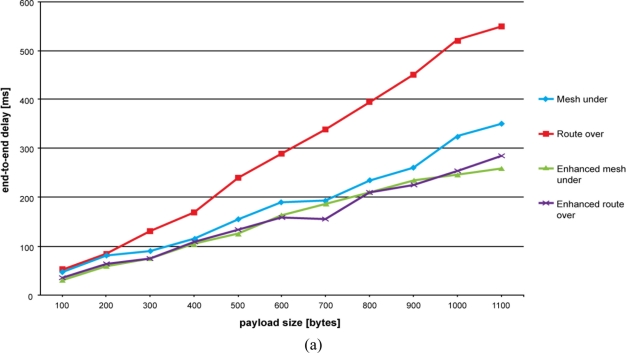
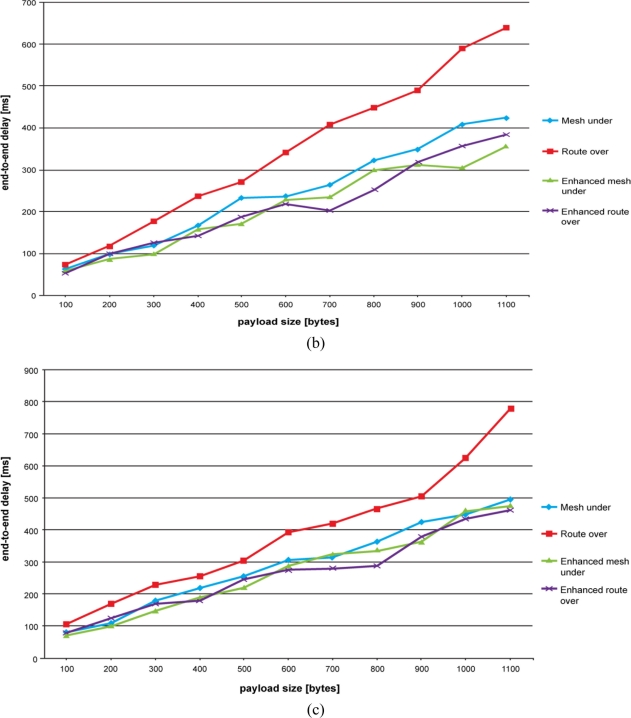
Figure 5.
End-to-end delay time evolution. The number of retransmissions is lower in controlled mesh under than in mesh under, resulting in a better end-to-end delay time trend. (a) End-to-end delay time for a two hops network. (b) End-to-end delay time for a three hops network. (c) End-to-end delay time for a four hops network.


