Figure 4.
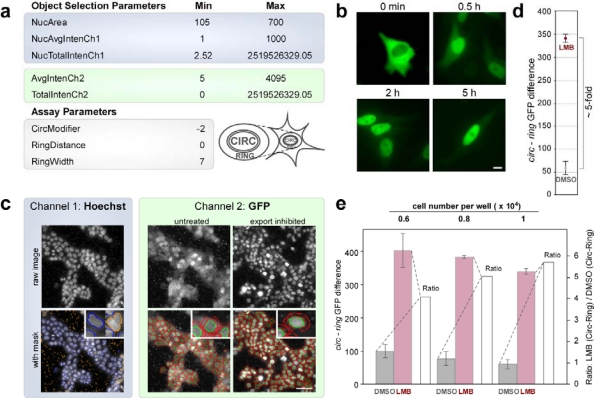
(a) Optimized object selection parameters (min/max settings) for channel 1 and 2 (highlighted in blue and green, respectively). (b) LMB treatment (10 nM) of A431bio cells resulted in a rapid nuclear accumulation of the biosensor already after 30 min, which remained stable also after 5 h without obvious cytotoxic effect on cell morphology. Scale bar, 10 μm. (c) Translocation assay analysis of A431bio cells using the Cellomics Arrayscan® VTI platform. The Hoechst and GFP signals were recorded in channel 1 and 2 (highlighted in blue and green), respectively, following LMB treatment (10 nM, 5 h). In the upper panel, the original raw images are shown. The lower panel shows the overlay with the respective masks. In channel 1, cells selected for further analysis are outlined in blue, cells rejected due to their size or shape are outlined in orange. In channel 2, the CIRC mask and RING region are outlined in green or red, respectively. Scale bar, 50 μm. (d) Average signal difference (CIRC-RING) of LMB treated cells (10 nM, 5 h) versus DMSO assay controls in one representative 384-well plate. 1 × 10⁴ cells/well were seeded, and the values were derived from analyzing ∼500 cells/well (see Table 1 for details) revealing a translocation index of > 5-fold. (e) Differences in assay performance depending on cell density. The indicated numbers of A431bio cells were seeded into 384-well plates. Sixteen h later, cells were treated with LMB (10 nM) or DMSO as a control for 5 h, and the translocation index quantitated using the Cellomics Arrayscan® VTI imager. CIRC-RING differences were plotted for DMSO control (grey) and LMB treated (red) cells (left scale). The ratio of these values (white columns) performed best for 1 × 10⁴ seeded cells/well. Columns, mean; bars, SD.

