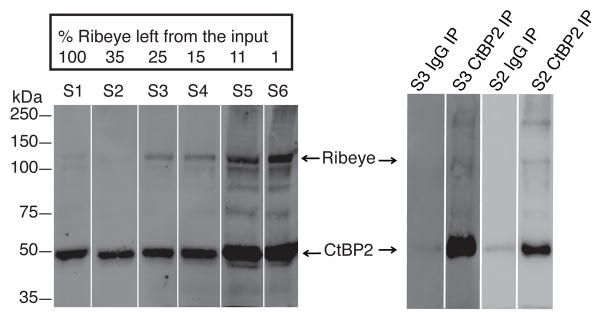
Figure 1.
Left panel: Loss of Ribeye during the purification scheme used for ribbon isolation based on the protocol developed originally by Schmitz. Western blots were used to separate Ribeye from CtBP2 (short) allowing calculation of the ramaining amount of Ribeye, based on sample volume, intensity of Ribeye’s Western blot signal, and percent loaded material for each sample. CtBP2 Ab detects both CtBP2 and Ribeye running at 50 and 120 kDa respectively. With each additional purification step, the Ribeye signal became more pronounced relative to the CtBP2 isoform.
Right panel: Immunoprecipitation with CtBP2/Ribeye or control IgG antibody on fractions 3 (S3) and 2 (S2) from the ribbon purification. The control IgG Ab has little background binding of CtBP2. The CtBP2 pull-down lanes have a very strong band around 50 kDa corresponding to the CtBP2 (short) isoform and a weakly stained, longer form running at 120 kDa and corresponding to the Ribeye isoform. The high molecular weight band above might represent multimers of the CtBP2 isoforms for it appears specifically in the CtBP2/Ribeye IP lanes only.

