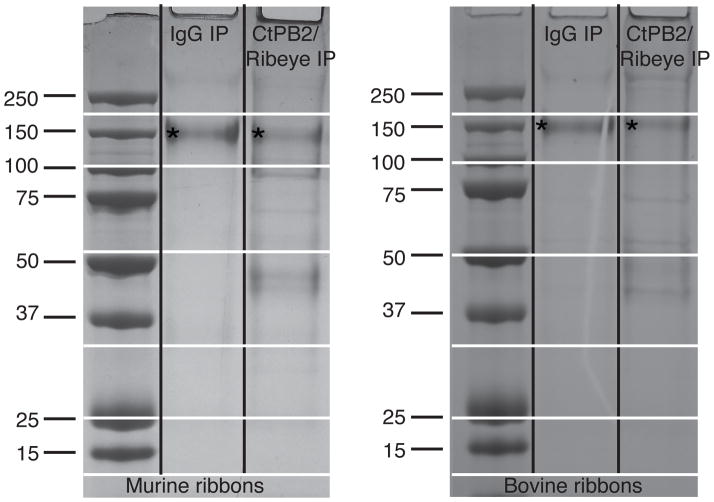
Figure 3. Coomassie Blue staining of the affinity purified ribbons using CtBP2 antibody and control IgG.
The 150 kDa non-reduced Ab molecule is indicated with an asterisk. A small fraction is also broken down to heavy and light chains −50 and 25 kDa respectively. The more abundant additional bands are clearly visible in the CtPB2 IP lanes, although the scanned image does not depict less abundant proteins segregating into faintly stained bands. The horizontal lines indicate the cutting sites when slicing the gel into discrete portions for sequencing.

