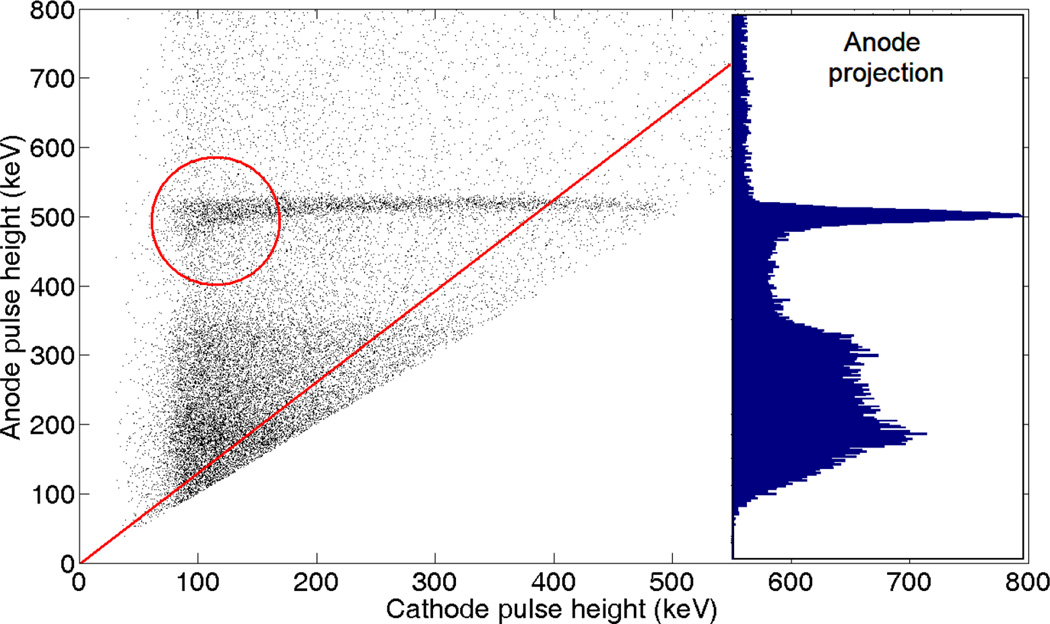
Figure 10.
Cathode-anode signal scatter plot for an uncollimated 22Na photon source irradiating the detector edge (at all depths). Events shown have C/A ratio between 0 and 1. The circled region highlights the events that contribute to low energy tailing of the photopeak due to reverse-polarity signal contribution from holes near the anode plane. The right inset spectrum corresponds to the result of collapsing all cathode signals onto the anode axis. The diagonal line shows the locus of all interactions with a cathode-to-anode signal amplitude ratio of 0.76 (see section 6.1).

