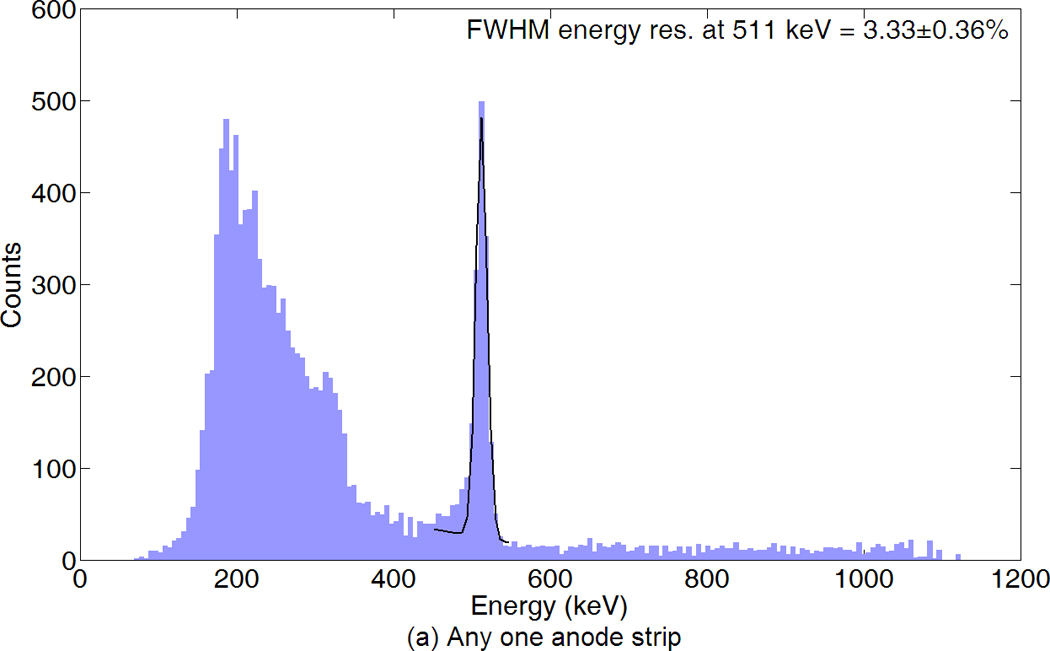
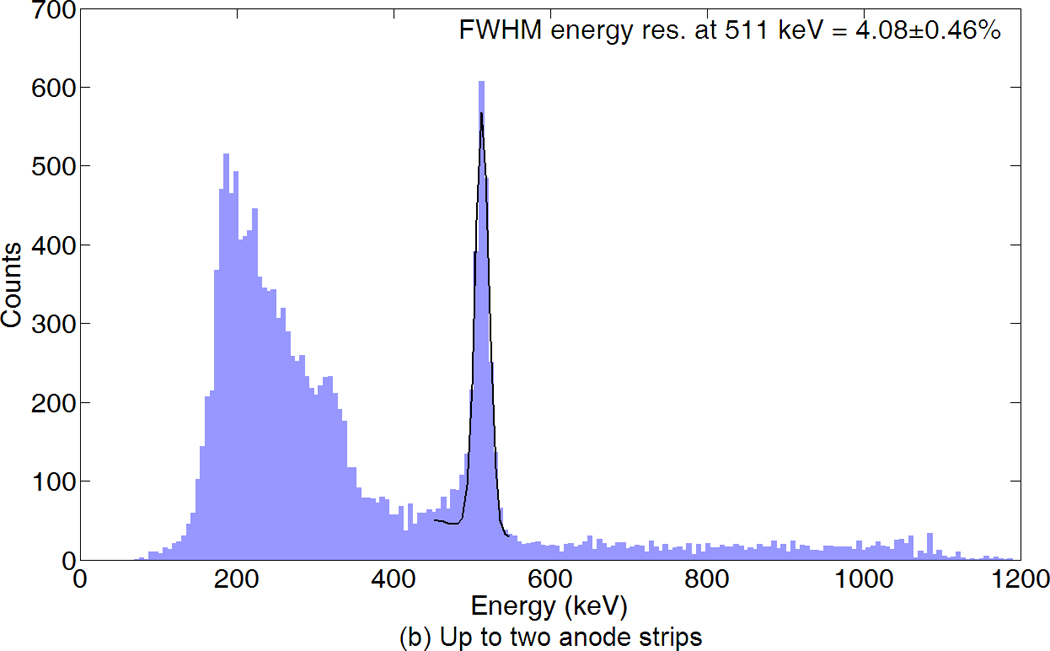
Figure 15.


Anode energy spectrum of photon interactions 3 mm (C/A ratio = 0.53) from the anode plane where the total energy per event is summed over (a) any one or (b) up to two anode strip signals. An uncollimated 22Na source was used to irradiate the edge of the 5 mm thick detector. The spectra have been corrected for depth-dependent signal deficit along the DOEP, and the error bar corresponds to the 95% confidence interval of the fitted parameters.
