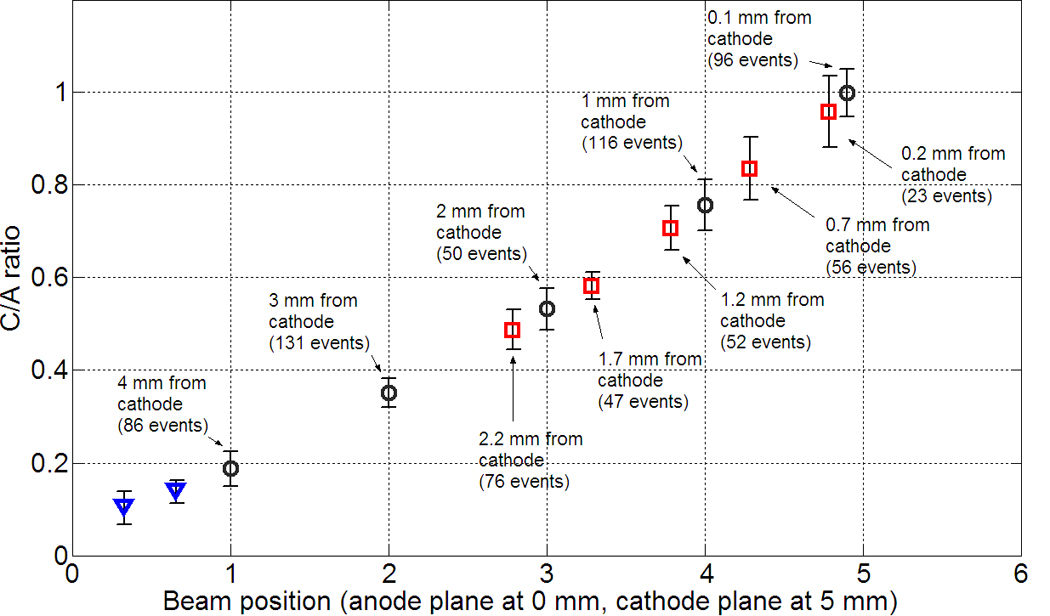
Figure 19.

C/A ratio as a function of collimated beam position irradiating edge-on between the anode and cathode planes. The error bars denote the extent of the FWHM for each data point; markers denote the mean values and are colour-coded black (circles, 1 mm spacing) and red (squares, 0.5 mm spacing) to the corresponding data points in figure 20. Blue triangles illustrate C/A values within the first 1 mm from the anode plane at 330 µm and 660 µm.
