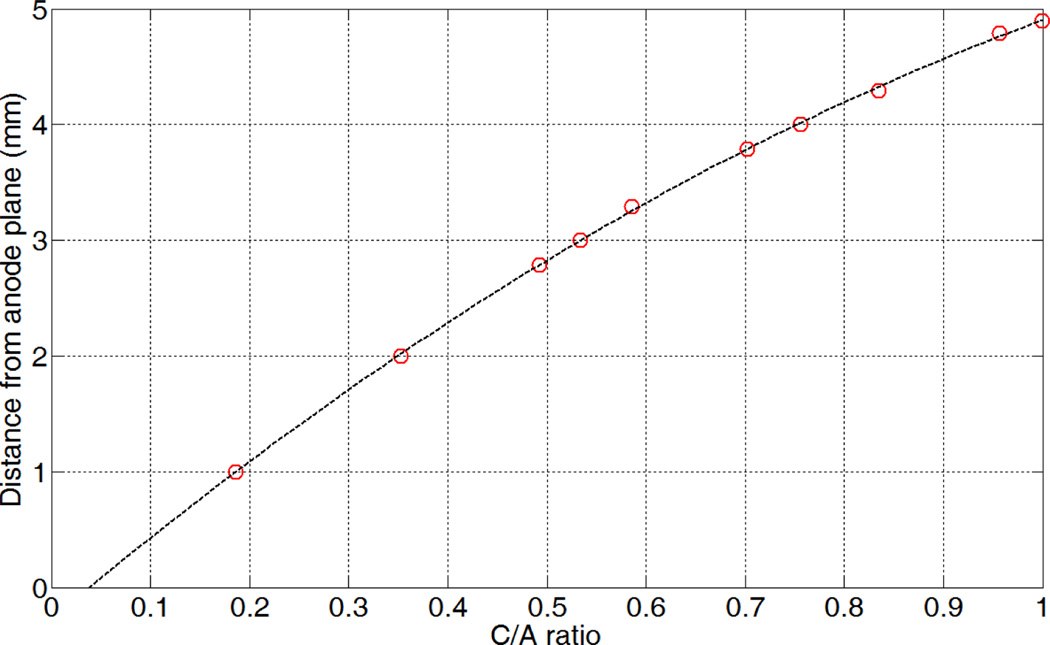
Figure 21.
Quadratic model of a photon interaction’s true DOEP position as a function of its C/A ratio (R2 error = 0.9997). The circles’ horizontal position denotes the mean C/A ratio (found by Gaussian curve fitting) corresponding to the collimated beam’s DOEP position as represented by the circles’ vertical position.

