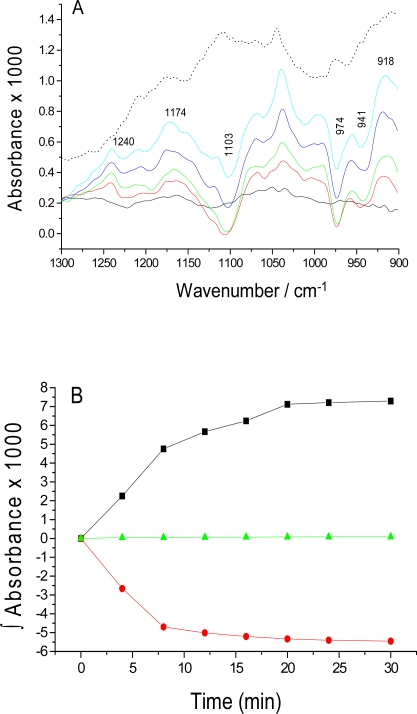
Figure 1.
Enzymatic reaction of PK. (A) Series of overlaid spectra (solid lines) of infrared absorbance changes upon PEP and ADP addition to PK, observed for 30 min. The solid line spectra were recorded at 12 s (black), 4 min (red), 8 min (green), 16 min (blue) and 30 min (cyan). The dotted line is the last spectrum (30 min) of the control experiments (shifted up). (B) Kinetics of the enzymatic reaction of PK, monitored by integrated band intensities at 1240 cm−1 (black) and 941 cm−1 (red) and the control experiment (941 cm−1, green). Time zero is the time when recording of the first spectrum after the background spectrum started.

