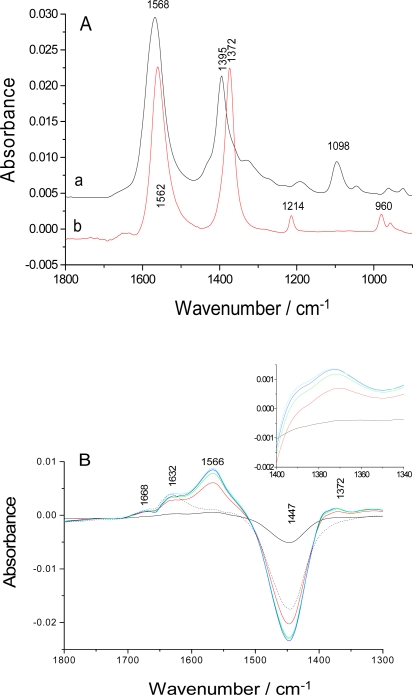
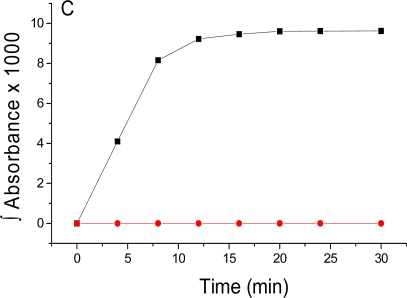
Figure 2.
(A) Infrared spectra of 100 mM malate (trace a) and fumarate (trace b) in H2O at pH 7.5. (B) Series of overlaid spectra of infrared absorbance changes due to the malic acid to fumarate reaction. The solid line spectra were recorded at 12 s (black), 4 min (red), 8 min (green), 16 min (blue) and 30 min (cyan) and the dotted line spectrum is the last spectrum of the control experiments without malic acid (30 min). The insert in panel B is an expanded view of the 1372 cm−1 band. (C) Kinetics of the enzymatic reaction of fumarase, monitored by the integrated band intensity at 1372 cm−1 for reaction (black) and the control (red) experiments.


