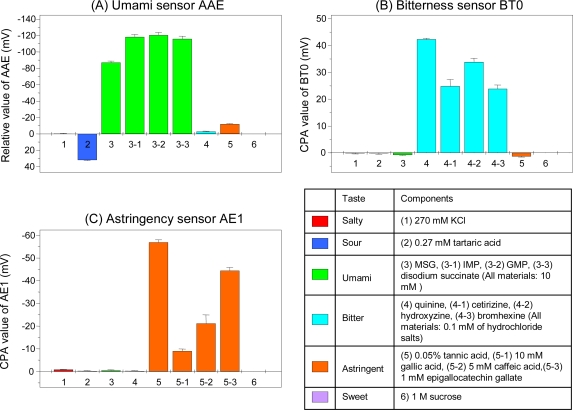
Figure 11.
Responses of taste sensors to six tastes. Figure 11A uses the relative value of the umami sensor AAE; Figure 11B, the CPA value of the bitterness sensor BT0; Figure 11C, the CPA value of the astringency sensor AE1. Data are expressed as mean ±SD (n = 4). All samples include 30 mM KCl and 0.3 mM tartaric acid as supporting electrolyte. MSG, monosodium glutamate; IMP, disodium 5′-inosine monophosphate; GMP, disodium 5′-guanosine monophosphate.

