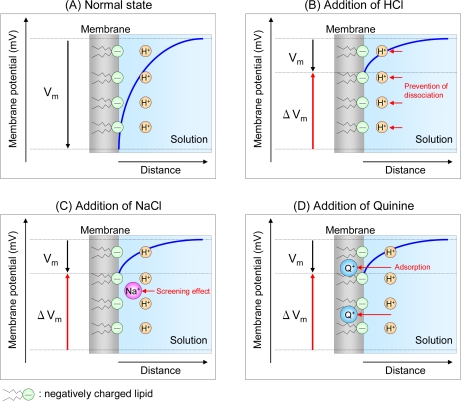
Figure 5.
Diagram of response mechanisms of negatively charged membrane to sour, salt, and bitter taste substances. Vm, membrane potential; ΔVm, change in membrane potential (sensor output); H+, proton dissociated from lipid molecule; Na+, sodium ion; Q+, quinine ion. The blue curve represents the change in electrical double layer with distance.

