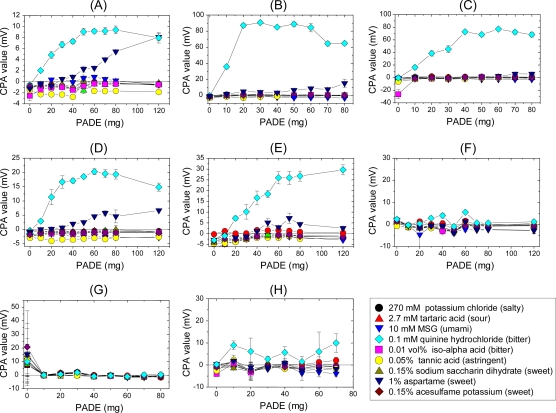
Figure 9.
Sensor responses to basic taste substances. The x-axis represents PADE contents in the membrane, while the y-axis shows the CPA value. Data are expressed as mean ±SD (n = 4). All samples include 30 mM KCl and 0.3 mM tartaric acid as supporting electrolyte. Lipid: PADE (phosphoric acid di-n-decyl ester); Plasticizer: A, DOPP; B, BBPA; C, BEHS; D, PTEH; E, TBAC; F, TMSPM; G, DGDE; H, TOTM (Reprinted with permission from the Institute of Electrical Engineers of Japan [55]).

