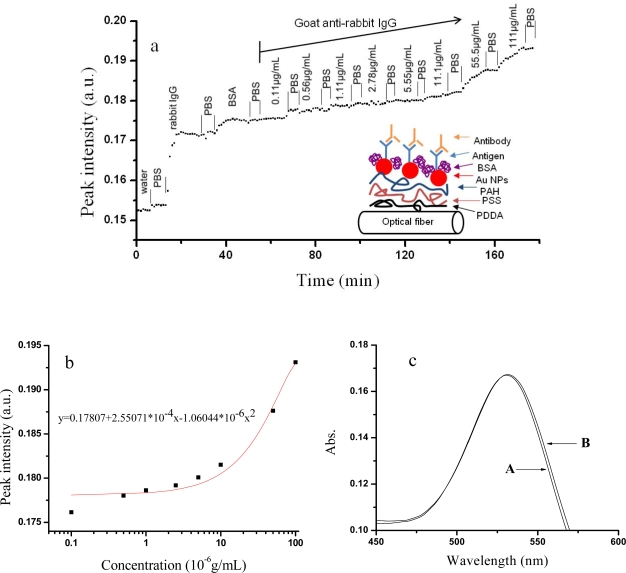
Figure 6.
(a) The LSPR biosensing of different concentrations of goat anti-rabbit IgG (0.11–100 μg/mL). (b) The standard curve of LSPR peak intensities with the antigen concentration of goat anti-rabbit IgG. (c) The LSPR sensing by using the present setup before (A) and after (B) 11.1ng/mL of goat anti-rabbit IgG was added.

