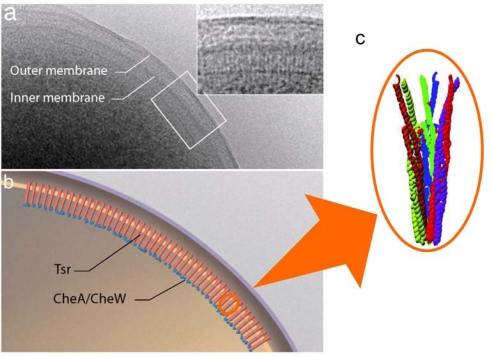
Figure 9.
Visualization and identification of chemoreceptor arrays. (a) Low-dose cryo-projection image of the polar region in a wild-type E. coli cell, with the chemoreceptor array shown in greater detail in the Inset. (b) Schematic representation of the polar region of a wild-type E. coli cell illustrating the assembly and orientation of the chemotaxis receptor array, based on a and b. (c) The trimer of dimers of the cytoplasmic fragment of Tsr as a crystal unit. Adopted from reference [162] and [164].

