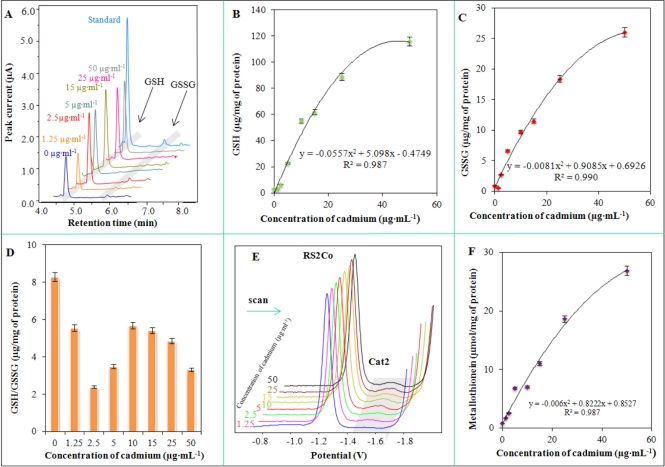
Figure 5.
(A) HPLC-ED chromatograms of cell lysates of S. aureus treated with cadmium(II) ions measured at 900 mV. Changes in the content of (B) GSH and (C) GSSG, and (D) GSH/GSSG ratio in cadmium(II) ion-treated S. aureus; (E) DP voltammograms of MT isolated from treated S. aureus; (F) Dependence of MT and MT-like proteins levels on the applied cadmium(II) ions concentration. Other experimental conditions are given in Figure 4 and in the Experimental section.

