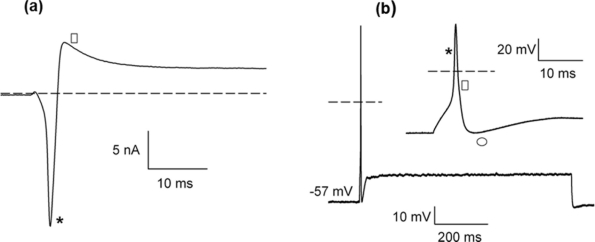
Figure 13.
Electrophysiological recording of neurons. (a) Voltage clamp recording shows an initial rapid inward current (*) followed by a slowly inactivating outward current (⎕) (dashed line represents zero nA). In (b) recording of the voltage response of a neuron to a current pulse of 600 pA. A typical action potential is discharged. In the inset, a time expansion of the action potential shows its typical characteristics with a fast rising phase (*) that reaches a peak value of about 40 mV. This is followed by a repolarizing phase (⎕) and post-potential hyperpolarization (R) that slowly decays (the dashed line represents 0 mV).

