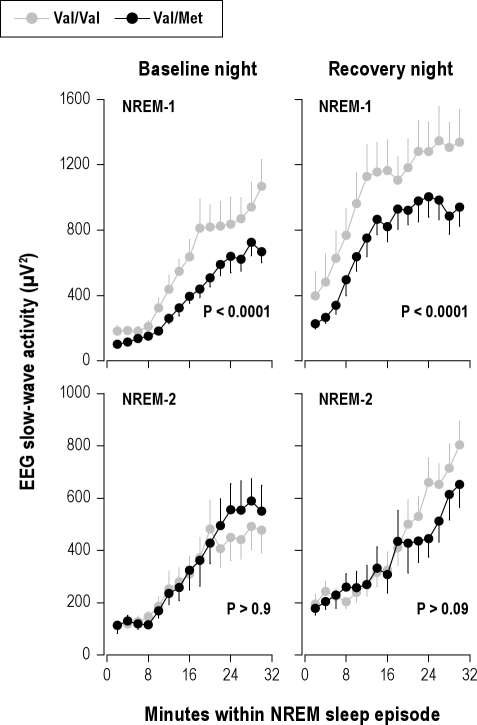
Figure 3.
Steeper build-up of initial slow-wave activity (SWA) in NREM sleep in Val/Val genotype of BDNF. Absolute EEG SWA (0.75-4.5 Hz; means ± SEM) values of consecutive 2-min epochs during the first 30 min of NREM sleep episodes 1 and 2 in baseline and recovery nights were plotted for Val/Val (gray dots, n = 11) and Val/Met (black dots, n = 11) genotypes. Data were analyzed with 4-way, mixed-model ANOVA with the within-subjects factors “genotype” (Val/Val, Val/Met), “condition” (baseline, recovery), “NREM sleep episode” (1, 2), and “2-min epoch” (1-15). SWA was significantly higher in Val/Val allele carriers than in Val/Met allele carriers (genotype: F1,91 = 9.3, P = 0.003), and the difference between the genotypes was modulated by NREM sleep episode (genotype × sleep episode: F1,148 = 6.1, P = 0.01). Separate analyses of NREM sleep episodes 1 and 2 revealed that the difference was restricted to NREM-1 (genotype: baseline, F1,56.4 = 37.7, P < 0.0001; recovery, F1,47.4 = 19.2, P < 0.0001) and not present in NREM-2 (baseline, F1,50 = 0.0, P > 0.9; recovery, F1,52 = 2.9, P > 0.09). To estimate the rise rates of SWA in Val/Val and Val/Met genotypes, the median slopes of adjacent 2-min intervals in the first 30 minutes of NREM sleep episodes 1 and 2 were calculated in baseline and recovery nights. The data were analyzed with 3-way, mixed-model ANOVA with the within-subjects factors “genotype” (Val/Val, Val/Met), “NREM sleep episode” (1, 2), and “condition” (baseline, recovery). The build-up rate of SWA was faster in Val/Val genotype than in Val/Met genotype (NREM-1, baseline: 64.3 ± 13.1 vs. 27.2 ± 5.4 μV2/min; NREM-1, recovery: 76.3 ± 14.8 vs. 57.0 ± 14.5 μV2/min; NREM-2, baseline: 29.8 ± 5.4 vs. 17.6 ± 10.0 μV2/min; NREM-2, recovery: 37.5 ± 7.3 vs. 29.3 ± 9.7 μV2/min) (genotype: F1,70 = 3.8, P < 0.06; NREM sleep episode: F1,70 = 13.8, P < 0.001; condition: F1,70 = 3.8, P < 0.06; genotype × NREM sleep episode: F1,70 = 5.2, P < 0.03). Separate analyses of NREM sleep episodes 1 and 2 showed that the difference was present in NREM-1 (genotype: F1,30 = 7.4, P < 0.02), but not in NREM-2 (genotype: F1,30 = 0.1, P > 0.7).

