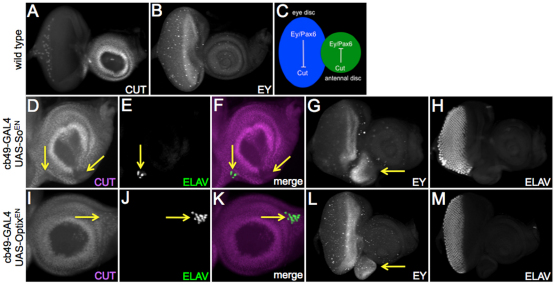
Fig. 4.
The antennal selector gene cut is a potential target of both Sine oculis and Optix. (A,B,D-M) Confocal images of third larval instar eye-antennal discs. Arrows in D,I indicate repression of ct expression; in G,L, they indicate de-repression of ey expression; in E,J,F,K, they indicate the formation of photoreceptors. (C) Model in which Ey and Cut mutually repress each other’s transcription.

