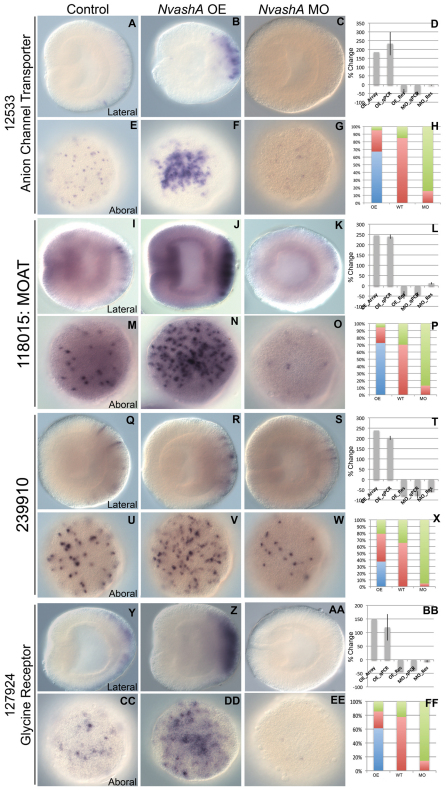
Fig. 3.
Aboral ectodermal targets of NvashA identified in embryonic ectoderm. (A-FF) Expression of 12533 (A-C,E-G), 118015 (I-K,M-O), 239910 (Q-S,U-W), and 127924 (Y-AA,CC-EE) in wild-type (A,E,I,M,Q,U,Y,CC), NvashA:venus overexpressing (OE) (B,F,J,N,R,V,Z,DD) and NvashA morphant (MO) (C,G,K,O,S,W,AA,EE) animals. The phenotypes for in situ hybridization experiments were quantified by distribution of increased (blue), wild-type (red) or decreased (green) levels of expression and cell number for NvashA:venus (OE), wild-type (WT) and NvashA morphant (MO) animals (H,P,X,FF). [For H, n=61 (OE), n=33 (WT) n=45 (MO); for P, n=55 (OE), n=37 (WT), n=31 (MO); for X, n=57 (OE), n=75 (WT), n=130 (MO); for FF, n=62 (OE), n=49 (WT), n=42 (MO).] The percent change of expression levels was also quantified (D,L,T,BB). Shown is the percent change observed by microarray for OE animals (OE_Array) and by qPCR (OE_qPCR, MO_qPCR) compared with wild type. The reversal of the NvashA:venus phenotype by co-injecting NvashA translation-blocking MO (OE_Res) and the reversal of NvashA morphant phenotype by co-injection of MO and NtruncNvashA:venus (MO_Res) are also shown. With the exception of the OE_Array, all qPCR percent changes shown are the average of two biological replicates. Error bars represent s.e.m. Oral is to the left in A-C,I-K,Q-S,Y-AA, and aboral views are shown in E-G,M-O,U-W,CC-EE.

