Fig. 5.
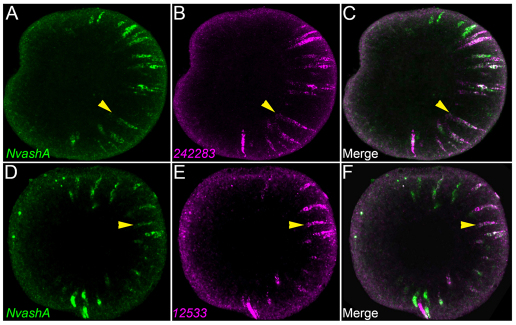
NvashA co-expression with 242283 and 12533 neural markers. (A-C) z-projection (15 μm) from confocal z-series of double fluorescent in situ hybridization showing expression of NvashA (A,C; green) and 242283 (B,C; magenta). In each animal, 69% of cells showed co-expression of NvashA and 242283 (n=10 animals with>50 cells scored per animal). (D-F) z-projection (16.5 μm) from confocal z-series of double fluorescent in situ hybridization showing expression of NvashA (D,F; green) and 12533 (E,F; magenta). In each animal, 64% of cells showed co-expression of NvashA and 12533 (n=6 animals with >30 cells scored per animal). All images are lateral view with oral to the left. Yellow arrows indicate examples of double-positive cells.

