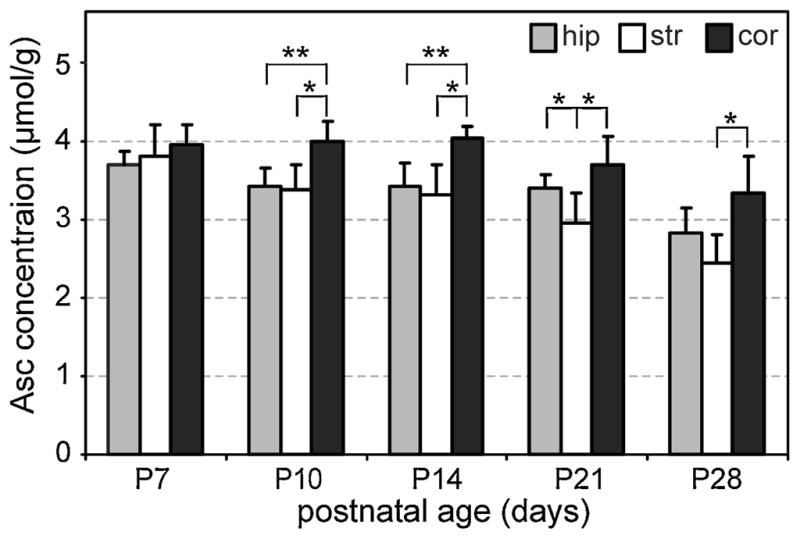
Figure 2.

Ascorbate (Asc) concentrations (mean ± SD) measured in the developing rat hippocampus (hip), striatum (str) and cortex (cor). Significant differences among regions were measured at all ages past postnatal day P7, and are reported as *p < 0.01 or **p < 0.001 without adjustment for multiple comparisons. The numbers of spectra analyzed for each region on P7, P10, P14, P21 and P28 were 8, 12, 12, 11 and 9 for hippocampus, 5, 6, 7, 8 and 7 for striatum and 5, 5, 5, 6 and 4 for cortex, respectively.
