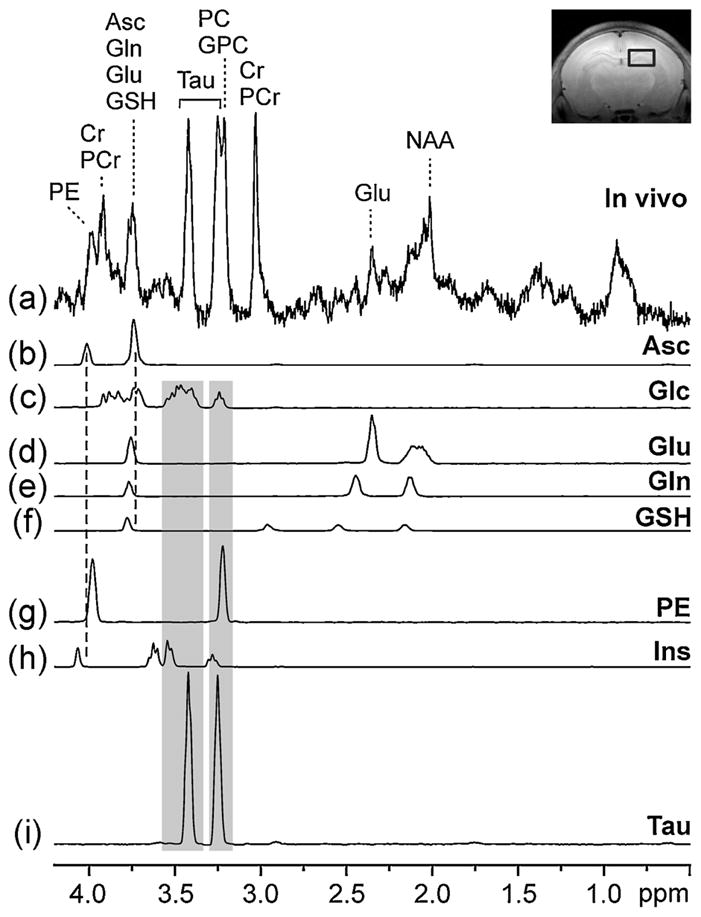
Figure 3.

LCModel analysis of a representative 1H NMR spectrum measured from the rat hippocampus on postnatal day P7. Only metabolites overlapping directly or indirectly with ascorbate (Asc) are shown. (a) Representative in vivo 1H NMR spectrum [stimulated echo acquisition mode (STEAM); TE = 2 ms; TR = 5 s; number of transients (NT), 320]; (b–i) metabolite spectra quantified by LCModel analysis; (c–g) metabolites directly overlapping with Asc (broken lines); (h, i) metabolites indirectly overlapping with Asc through glucose (Glc) (shaded regions). Inset: axial MR image illustrating the position of the volume of interest (VOI) which was centered in the hippocampus. See text for abbreviations.
