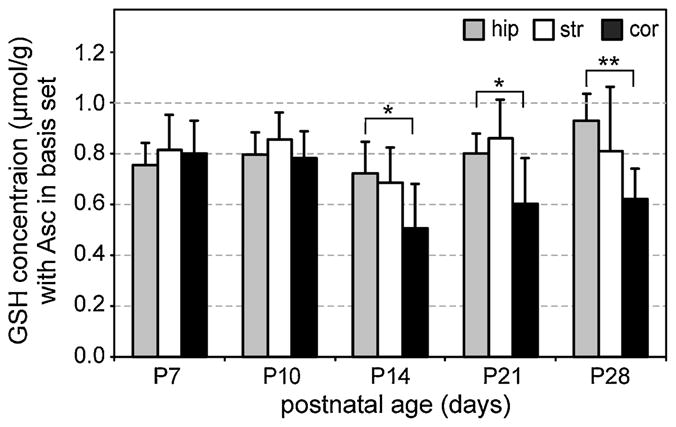
Figure 5.

Glutathione (GSH) concentrations (mean ± SD) quantified in the developing rat hippocampus (hip), striatum (str) and cortex (cor) with ascorbate (Asc) included in the LCModel basis set. This was the only metabolite from the whole neurochemical profile for which minor changes in quantification relative to those originally reported (16) were noticeable. Significant differences between the hippocampus and cortex were measured at postnatal day P14 and beyond, and are reported as *p < 0.01 and **p < 0.001 without adjustment for multiple comparisons. The numbers of spectra analyzed for each region and age are the same as reported in Fig. 2.
