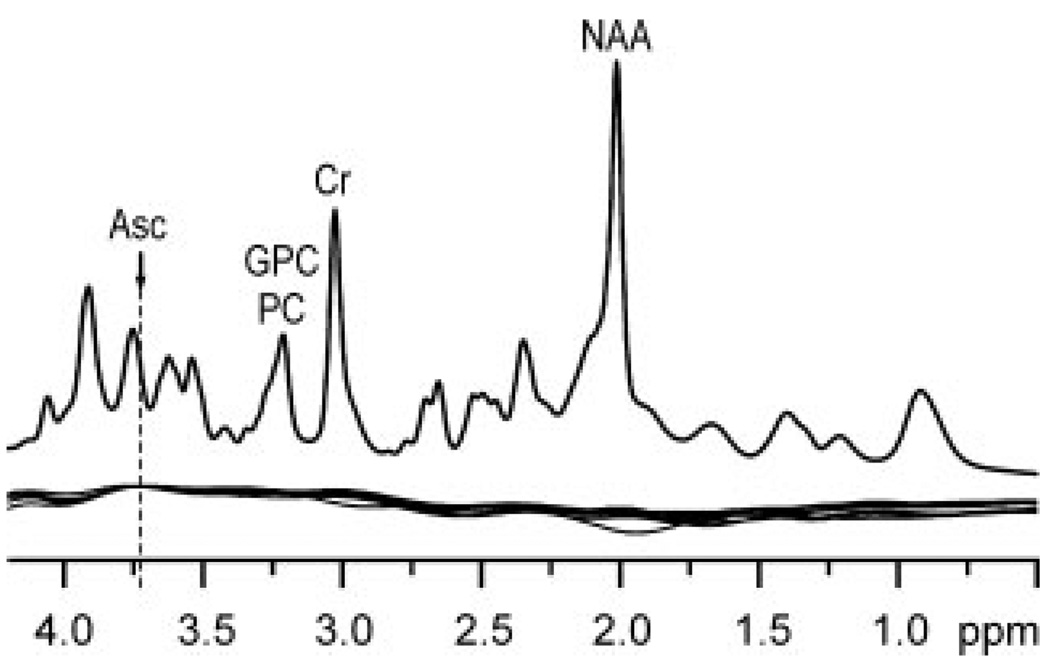
Figure 2.
Top: representative in vivo short-echo-time STEAM spectrum (TE = 6 ms, TR = 5 s, NT = 160). Apodization: Gaussian multiplication (σ = 0.1 s). Bottom: overlaid spline baseline functions for LCModel analysis of the 8 short-echo time STEAM spectra measured from the occipital lobes of healthy subjects.

