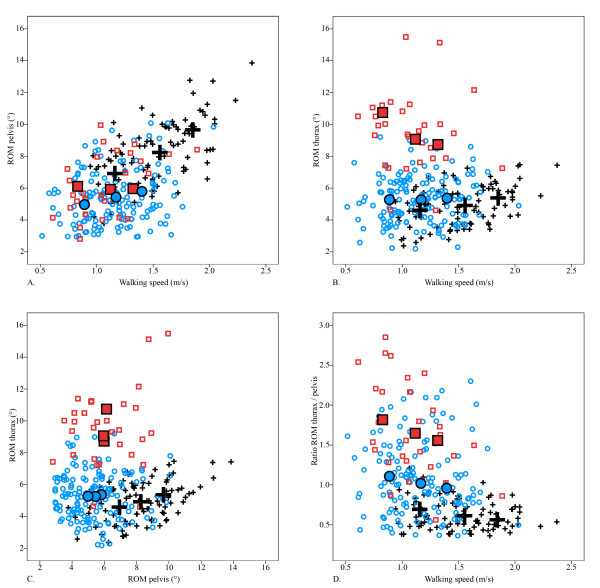
Figure 1.
All data are presented for low, preferred and high walking speed. Small figures indicate individual values, large figures indicate mean values. Healthy controls (+: black); patients with a Duchenne limp (□: red); patients without a Duchenne limp (○: blue). Abbreviations: ROM, Range of Motion.

