
Figure 1.
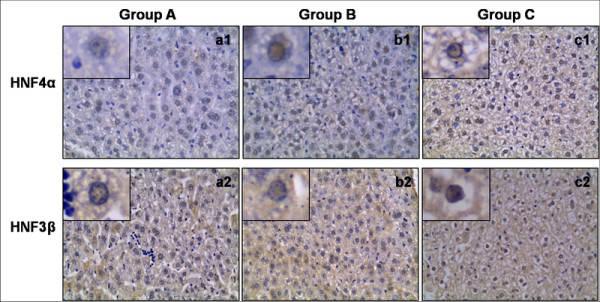
The expression of HNF4α and HNF3βin liver tissue of typical patients in three groups were shown. The scores of HNF4α were higher in c1 as compared to a1 and b1; while the scores of HNF3 were similar among a2, b2 and c2.
Official websites use .gov
A
.gov website belongs to an official
government organization in the United States.
Secure .gov websites use HTTPS
A lock (
) or https:// means you've safely
connected to the .gov website. Share sensitive
information only on official, secure websites.
The expression of HNF4α and HNF3βin liver tissue of typical patients in three groups were shown. The scores of HNF4α were higher in c1 as compared to a1 and b1; while the scores of HNF3 were similar among a2, b2 and c2.