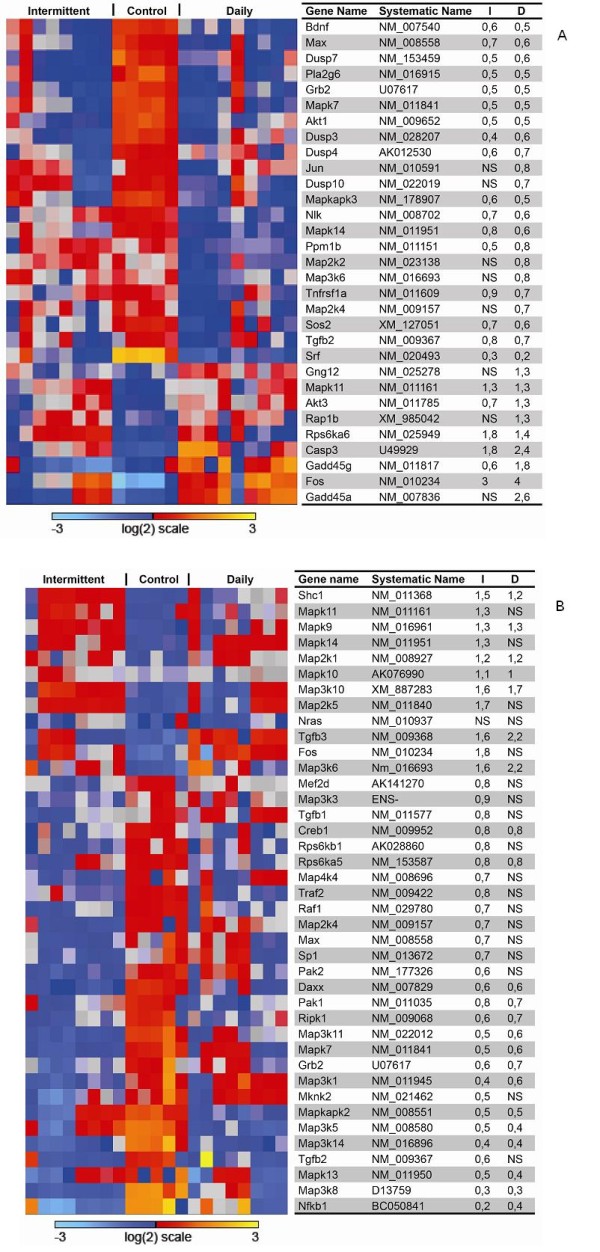
Figure 4.

MAPK pathway, tumor (a) and stroma (b). Heatmap of genes in the MAPK pathway (HSA04010). The table display gene names, systematic names, and fold change of gene expression compared to control of intermittent (I) and daily (D) hyperbaric oxygen (HBO), respectively. Intermittent and daily HBO treatment suppressed MAPK signaling pathway in both tumor cells and stromal cells compared to control. NS = not significant.
