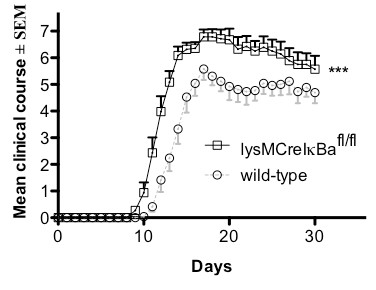
Figure 3.

The clinical course of MOG-EAE in lysMCreIκBαfl/fl mice is more severe. Clinical course of EAE in wild-type mice (n = 13) and lysMCreIκBαfl/fl mice (n = 14). lysMCreIκBαfl/fl mice (black curve) show a significantly earlier start and a more severe course of disease compared to wild-type mice (grey curve). Data represent the mean of two independent experiments ± SEM.
