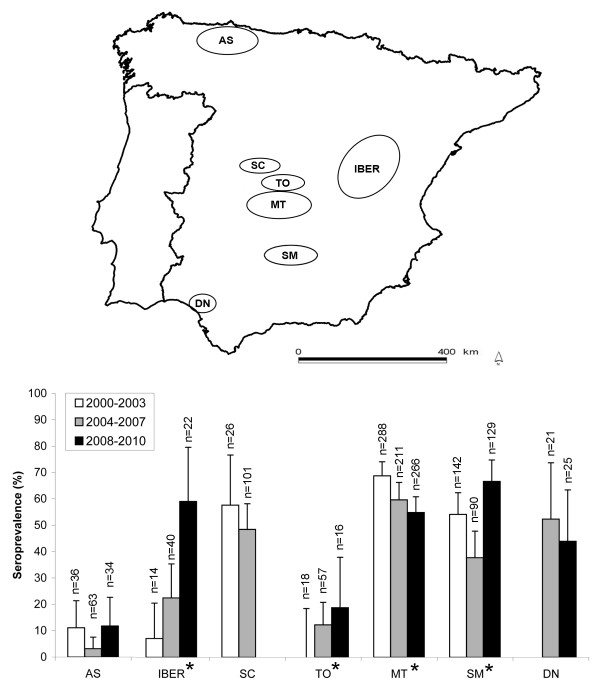
Figure 1.
Sampled areas and Aujeszky's disease virus (ADV) seroprevalences. Map of the Iberian Peninsula showing the six sampled areas for the study (upper panel). Seroprevalences (and associated 95% standard errors) for each area during the three considered seasons (2000-2003, 2004-2007, 2008-2010) are shown in the lower panel. Within each area, significant differences in overall season seroprevalence are marked with an asterisk.

