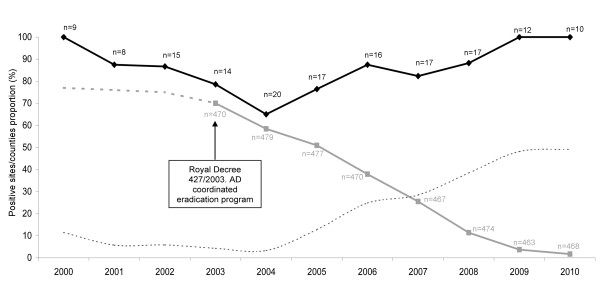
Figure 2.
Temporal trends on Aujeszky's disease virus (ADV) seroprevalences in wild boar and pig. Time trend (2000-2010) of the annual proportion of sampling sites with seropositive wild boar (black diamonds), and of the proportion of counties in Spain with ADV in domestic pig (grey squares; based on data from the Spanish Ministry of the Environment and Rural and Marine Affairs, MARM). Numbers on the black line indicate the number of wild boar sampling sites per year. Numbers in grey indicate the number of reported counties per year. The discontinuous grey line is an estimated prevalence of positive counties before 2003 as data were not available before this date. The dotted line represents the hypothetical relative risk of ADV spill-back from wild boar to domestic pig, based on the difference between the pig and wild boar ADV proportions.

