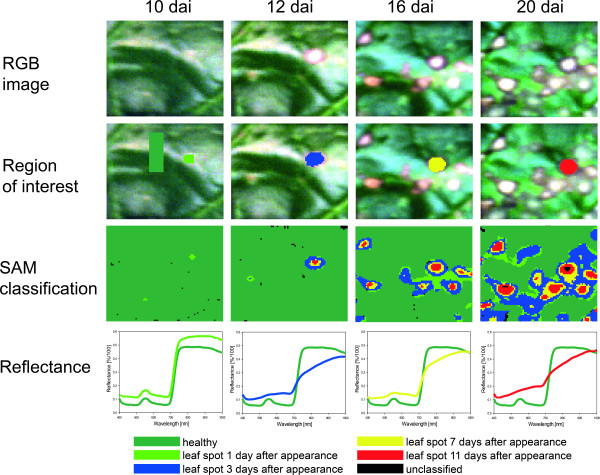
Figure 6.
Spatial and temporal dynamics in hyperspectral signature of Cercospora leaf spot during pathogenesis. RGB images of infected sugar beet tissue (first row); region of interest (ROI) for the extraction of characteristic spectral signatures for the classes healthy tissue (light green), leaf spot 1 (light green) 3 (blue), 7 (yellow) and 11 (red) days after appearance, respectively (second row); Spectral Angle Mapper (SAM) classification based on spectral signatures from ROIs (third row); spectral signatures for each class (last row).

