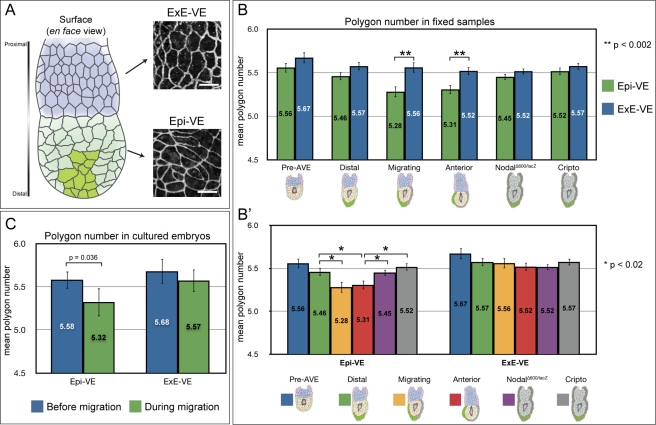
Figure 1. Cell packing within the visceral endoderm changes with AVE migration.
(A) At left, diagram illustrating the mouse egg-cylinder, with the ExE-VE in blue (situated proximally) and Epi-VE in light green (situated distally). AVE cells are marked in dark green. At right, high magnification views of the VE of an egg-cylinder stage mouse embryo stained with ZO-1, showing differences in cell shape in the ExE-VE and Epi-VE. Scale bars = 25 µm. (B) The mean polygon number in the ExE-VE and Epi-VE at different wild-type stages (“pre-AVE”: before AVE induction, n = 337 Epi-VE and 231 ExE-VE cells from four embryos; “distal”: AVE at distal tip before migration, n = 497 Epi-VE and 396 ExE-VE cells from four embryos; “migrating”: AVE migrating, n = 300 Epi-VE and 236 ExE-VE cells from three embryos; and “anterior”: AVE finished proximal migration and moving laterally, n = 480 Epi-VE and 409 ExE-VE cells from three embryos) and in the AVE arrest mutants NodalΔ600/lacZ (n = 724 Epi-VE and 565 ExE-VE cells from five embryos) and Cripto −/− (n = 605 Epi-VE and 598 ExE-VE cells from five embryos). At “migrating” and “anterior” stages, the mean polygon number in the Epi-VE is significantly lower than that in the ExE-VE. AVE arrest mutants isolated at a stage comparable to “anterior” embryos do not show this significant reduction in polygon number in the Epi-VE. (B′) The same polygon number data grouped according to the VE region. In the Epi-VE, mean polygon number in “migrating” and “anterior” embryos is significantly lower than that in “distal” embryos. The Epi-VE of AVE arrest mutants has a mean polygon number that is significantly different to that of stage matched “anterior” embryos but more similar to that of “distal” embryos. (C) Mean polygon numbers of Epi-VE (n = 31) and ExE-VE (n = 28) cells in five cultured embryos, measured at the start of and during AVE migration. The mean polygon number of the Epi-VE cells reduced significantly during migration, while that of the ExE-VE cells did not. p values shown on the graphs were determined using Student's t test.

