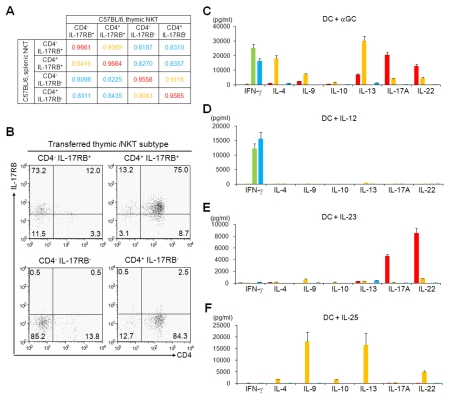
Figure 5. Function of iNKT cell subtypes in the spleen.
(A) Global gene expression profiles in iNKT subtypes in the thymus and spleen. Tree view representation of clustering analysis among the four iNKT subtypes in thymus and spleen from B6 and BALB/c. The values represent coefficients between the indicated panels. r 2>0.95 in red, 0.85<r 2<0.95 in orange, and r 2<0.85 in blue. One representative experiment of three is shown. (B) Plasticity and stability of iNKT subtypes. The four iNKT cell subtypes in the thymus were sorted and each subtype (5×10⁵) was i.v. transferred into independent Jα18 −/− mice (n = 3). 10 d after transfer, α-GalCer/CD1d dimer+ TCRβ+ cells in spleen were analyzed by FACS for the expression of IL-17RB and CD4. Representative data from three experiments are shown. (C–F) In vitro cytokine production by splenic iNKT cell subtypes (red, CD4− IL-17RB+; orange, CD4+ IL-17RB+; blue, CD4− IL-17RB−; green, CD4+ IL-17RB−). Sorted splenic iNKT subtypes (5×10⁴ cells/100 µL) were co-cultured with BM-DCs (5×10³/100 µL) for 48 h in the presence of α-GalCer (100 ng/µL) (C), IL-12 (10 ng/µL) (D), IL-23 (10 ng/µL) (E), and IL-25 (10 ng/µL) (F). Levels of IFN-γ, IL-4, IL-9, IL-10, IL-13, IL-17A, and IL-22 in the supernatants were analyzed by ELISA or CBA. Data are mean ± SD of triplicate wells. One representative experiment of three is shown.

