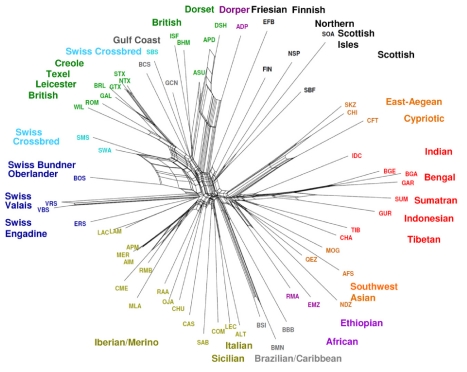
Figure 3. Relationship between breeds based on divergence time.
The divergence time between breeds (in generations) estimated using LD was used to draw a NeighborNet graph. Reticulations towards the extremity of each graph indicate increasing genetic relatedness between populations. The divergence times are visualised as a heatmap in Figure S10.

