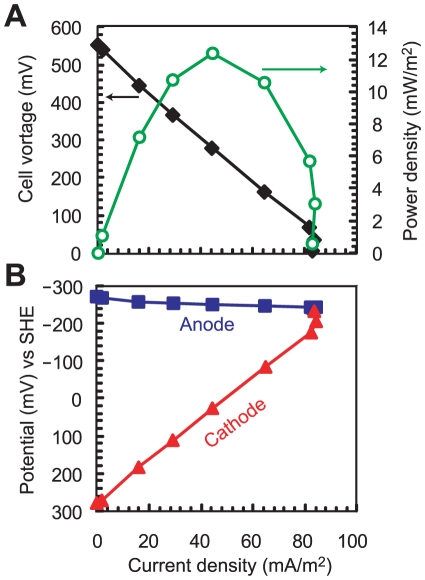
Figure 3. Power curve and polarization curves in the primary clarifier effluent-fed MFC.
Power curve (A) and anodic and cathodic polarization (B) measured from the MFC after stable current production was observed on day 32. Anode potential (solid square), cathode potential (solid triangle), and cell voltages (solid diamond) were measured at various external resistances and plotted versus current density normalized to the projected anode surface area. Reactor power performance is represented by power density per anode surface area (open circle).

