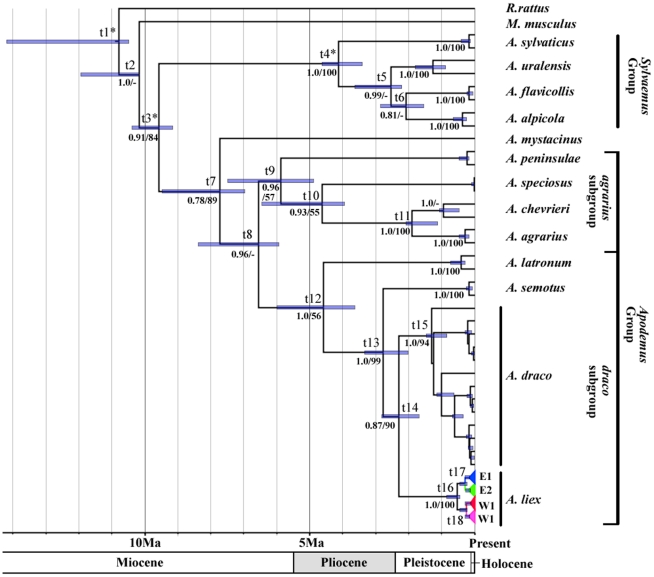
Figure 2. Chronogram of Apodemus based on cyt-b sequences.
Branch lengths represent time; Node bars indicate the 95% CI for the clade age; An asterisk indicates node for calibration; The tx above the nodes refer to median ages and 95% CI for each node in Table 2; Numbers below the nodes are Bayesian posterior probabilities (PP) and ML bootstrap (BS) values. A ‘-’ indicates the value is lower than 0.5 (PP) or 50 (BS).

