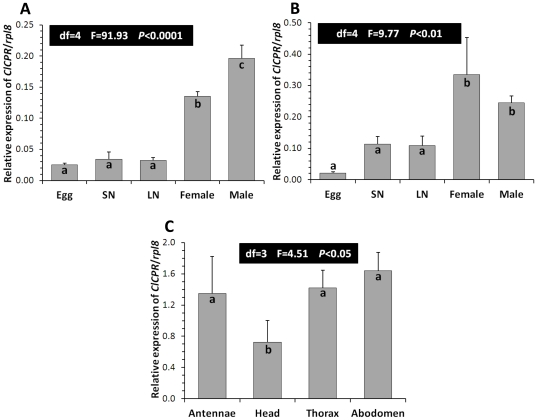
Figure 3. Spatial and temporal expression of ClCPR.
Changes in mRNA levels of the ClCPR in CIN-1 (A) and LA-1 (B) populations. Egg; SN, small nymph (1–3 instar); LN, large nymph (4–5 instar); female and male, 1 week old. The relative mRNA levels were shown as a ratio in comparison with the levels of rpl8 mRNA. The data shown are mean+SEM (n = 3). (C) Relative mRNA levels of the ClCPR in the antennae, head, thorax, and abdomen of the CIN-1. Tissues were dissected and total RNAs were isolated to quantify the ClCPR mRNA levels by qRT-PCR as described in Materials and Methods. Relative mRNA levels were normalized using the expression of rpl8. The data shown are mean+SEM (n = 4). Statistical significance of the gene expression among samples was calculated using one-way ANOVA followed by Duncan multiple mean separation techniques. There was no significant difference among relative expression within samples with the same alphabetic letter (i.e. a, b and c).

