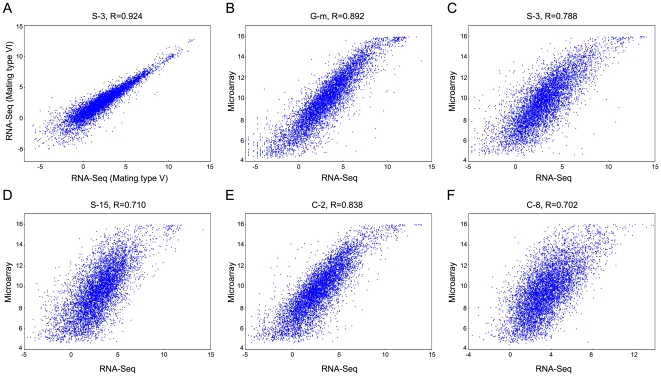
Figure 1. Correlation between RNA-seq and microarray data sets.
For RNA-seq, the LOG2 RPKM values were used; for microarrays, LOG2 fluorescence intensity values were used. The states G-m, S-3, S-15, C-2 and C-8 refer to growth to mid-log cell density (∼3.5×10⁵ cells/ml), 3 hours of starvation, 15 hours of starvation, 2 hours into conjugation and 8 hours into conjugation, respectively. Note the sigmoidal shape of the correlation curves, attributed to higher dynamic range of RNA-seq relative to microarrays at both ends of the gene expression range.

