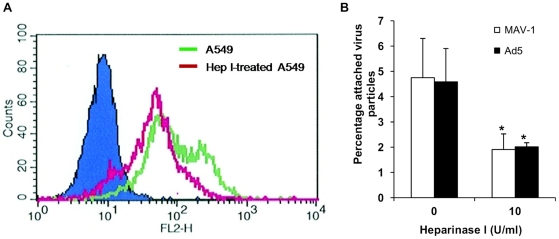
Figure 2. Effect of heparinase I treatment on MAV-1 and Ad5 attachment to A549 cells.
A. FACS analysis to assess the effect of heparinase I treatment (0 or 10 U/ml during 90 min at 37°C) on heparan sulfate expression in A549 cells. Fluorescence intensity is plotted against the number of events (counts). The green line indicates untreated A549; the red line represents heparinase I-treated A549. Background in the absence of primary antibody F58-10E4 is represented by the solid blue histogram. B. Binding experiments in A549 cells (pretreated with heparinase I as described in A) were performed as in Fig. 1. Binding capacities are presented as the percentage attached virus particles relative to the total amount of added virus particles. Means (±SEM) of three independent experiments are shown (each condition performed in duplicate). *, P<0.05 versus binding in the condition 0 U/ml heparinase I.

